Explore plant biodiversity at large scale and high resolution
GeoPl@nNet aims to make plant biodiversity easily accessible and understandable for everyone through high-resolution interactive maps and reports
GeoPl@nNet aims to make plant biodiversity easily accessible and understandable for everyone through high-resolution interactive maps and reports
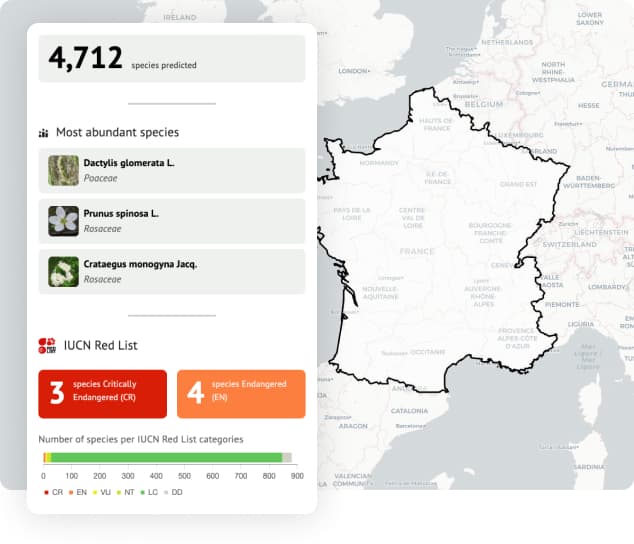
GeoPl@ntNet is able to generate biodiversity report at a global “country” scale or at a “local” scale.
Get immediate biodiversity report on a whole country.
Draw shapes on the map to get report tailored to your areas of interest.
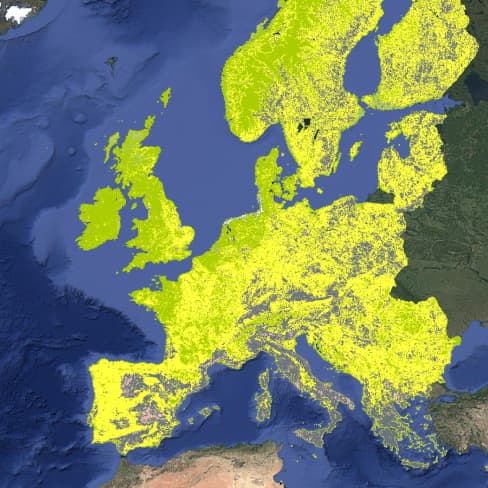
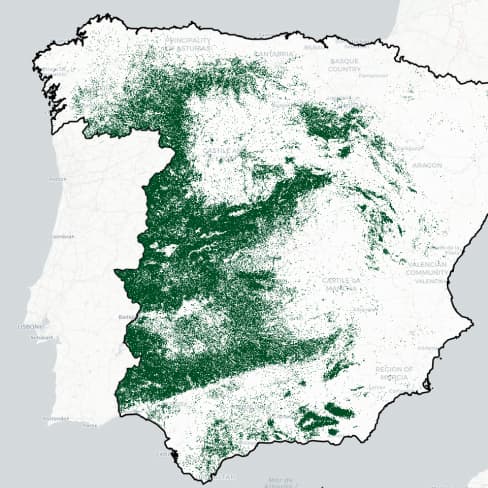
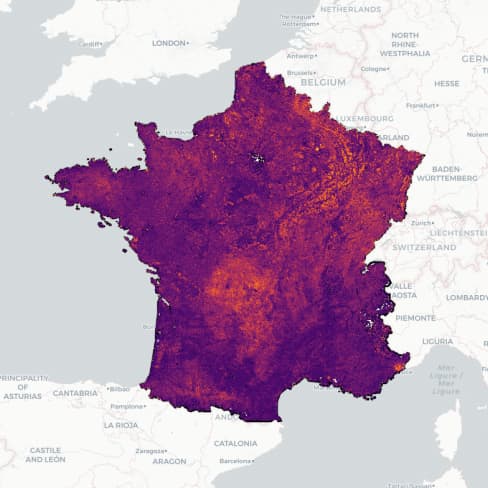
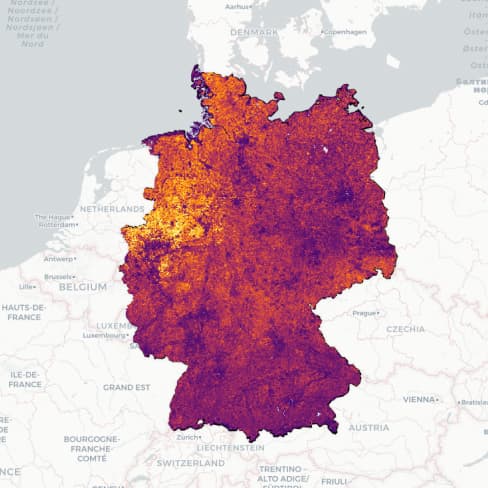
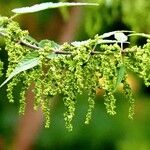
Explore the predictions maps of species at a 50m resolution across Europe and compare them with maps of real occurences.
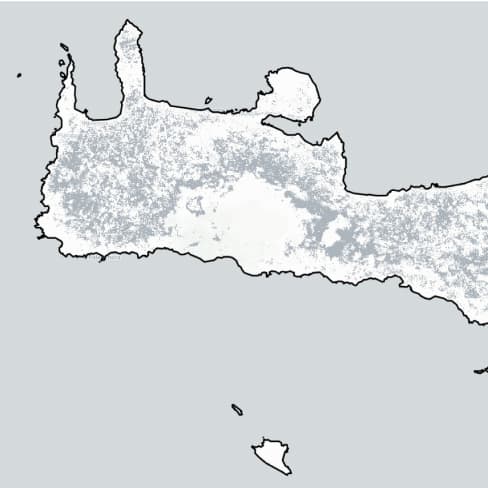
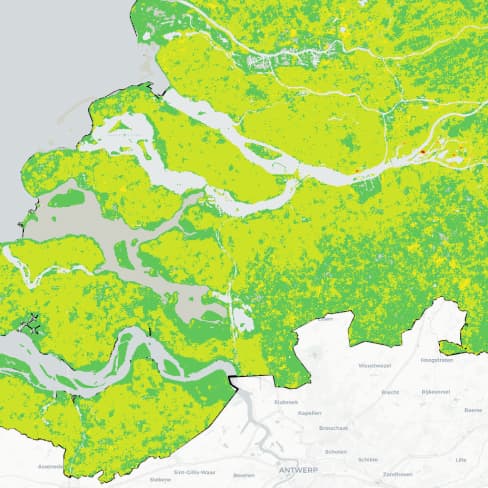
GeoPl@ntNet lets you explore maps of EUNIS habitats predicted across Europe. The predictions are made at EUNIS level 3 habitats and can also be explored aggregated at both level 1 & 2.
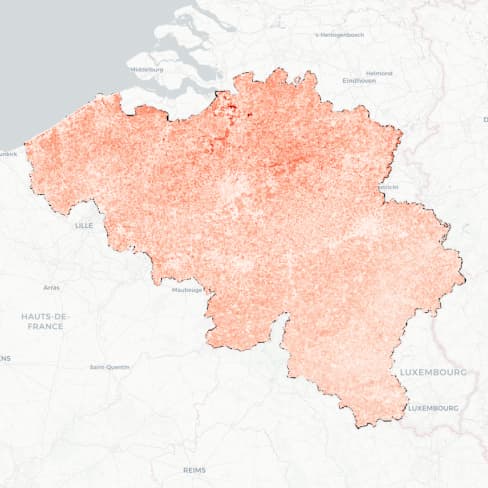
GeoPl@ntNet lets you explore maps of biodiversity indicators across Europe.
GeoPl@nNet is developed and maintained by the Pl@ntNet team as part of a consortium agreement between CIRAD, INRAE, INRIA and IRD.
GeoPl@ntNet receives funding from the European Union Horizon Europe Research and Innovation Programme (ID No 101060693, 101060639). Views and opinions expressed are those of the author(s) only and do not necessarily reflect those of the European Union or the European Research Executive Agency (REA). Neither the EU nor REA can be held responsible for them.